

How Does a Machine Vision Algorithm Detect Objects in an Image
- Vathslya Yedidi
- February 25, 2021
Introduction
As an AI/DL/ML enthusiast, you might have come across a lot of pre-trained network architecture which can be re-used for object detection and localization tasks without much effort in writing something from the scratch. Object detection using AI-Deep Learning keeps on evolving and we can see that most of the models developed to improve their detection capability along with prediction accuracy and response time. This article intends to discuss and share the basic concepts underlying object detection and how inventors might have sailed through the challenges, finding one solution at a time – thus inventing new architectures. The article does not elaborate on the details of the architecture or the arithmetic behind these network models.
To Begin With
Let us review a sample random image browsed on Google and understand the basis on how humans will interpret this image and start detecting objects, recognizing objects and then inferring information out of it. To keep it simple, let us focus on humans in the picture and the referenced objects to detect and infer information about. Every object in the image will have a role in inferring the context of this image.

Fig 1: Sample Image (Courtesy Google Image)
But since we are only talking about object detection, let us narrow down our focus on humans for simplified inference. When we first see this image, note down what comes first in your mind.
- Children playing
- Children playing in groups as well as alone
- Children playing with different play items
- Presence of an adult along with children
- and so on …
Now if you look a little closer, we could infer a few more details based on the level of expertise or information we have about the image context. As an example, from this image, you can assess the risk of falling for a certain child, or you can infer different engagement levels of children or an adult, probably a caretaker monitoring the children etc. Now you can see that the possibilities of inferences are countless. It depends on how much we, as observers, are informed, engaged and attentive about the given context.
Expectation from a machine
With Artificial Intelligence, this is what we expect a machine to do after analyzing an image. Is this possible with the current progress we have made with AI? A machine can do this provided we have the right technology support to detect an object, understand its context, infer information, and predict possibilities. With the current level of progress, we can see that object detection has become a reality. Understanding the context and inferring information is just in the storming stage. Predicting possibilities or the next possible action is not yet out for developers to play around.
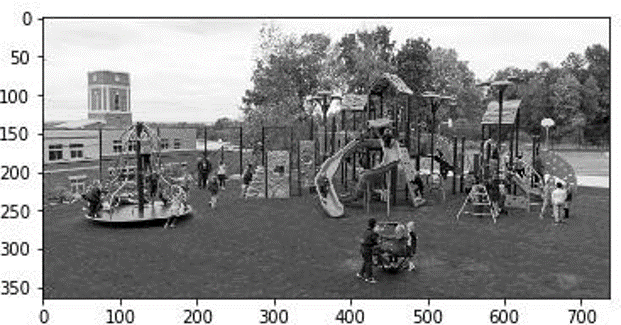
Fig 2: A Gray Scale Image
Being futuristic and a dreamer, I encourage all budding innovators, to think differently on how we can build a system that can transfer the knowledge of human inferencing and prediction capabilities to a machine algorithm…something different… Tough …uhm… Ok then let’s discuss how complex it was for the inventors to find an object and how they have cracked it ….step by step. Hopefully, it might lead us to explore other possibilities.
Let’s take one step at a time
Everyone agrees that an image has a wealth of information. Every region or pixel tells you something about its context. When we see an image, it can either be a single object image or a multiple object image. We can broadly classify this image into two groups – a background and a foreground. Having said that, this classification is again context-specific. If you have an object of interest, then that can be your foreground and everything else can be the background. Or, in case of videos or pictures, all static (stationary) items can be a background and only the moving image can be foreground. Else, if it is a natural image clicked outdoors, we consider our own experience to distinguish background from foreground based on some factors of choice. Now, you are facing the complexity of having a rule just to decide about the foreground and background.
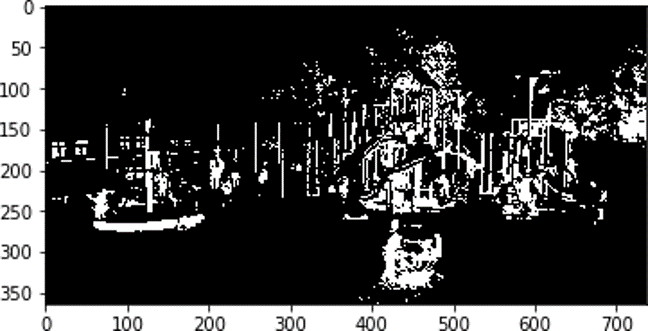
Fig 3: Basic Thresholding
Now it becomes very evident that we cannot actually define concrete and universal rules of classification. It shall be based on situations, context and our need. To begin with, let’s say that the region or pixel (feature) that comes below a particular threshold pixel value, we take it as background and area above that value is foreground. This we call it as thresholding or segmentation in Image Processing. There are different thresholding techniques – Figure 3 displays the output of a basic thresholding technique.
Now, we classify or segment the image into two sections – background and foreground. If we are able to get foreground, then we say that we are successful in detecting the presence of some objects in the image. This is just a baby step and is mostly error-prone. It does not generate much accurate information when the resultant output is compared with our original objective of competing for human intelligence with detecting an object.
For accurate segmentation, selection of the threshold value is very important. The success of segmentation depends heavily on identifying the best fit threshold value along with following an adaptive or a standard distribution curve for the segmentation process. A histogram could be of great help in selecting the threshold value. Figure 4 shows the histogram of pixel intensity for the sample grayscale image.
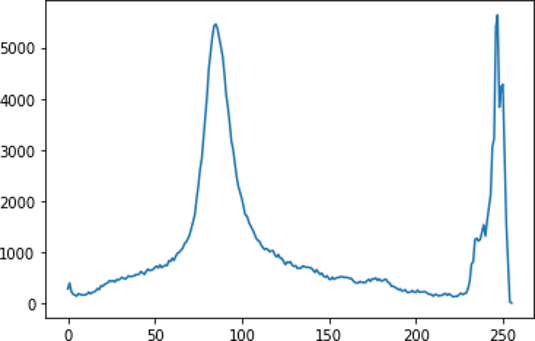
Fig 4: Image Histogram
Here we can see a clear cluster around 50-100 and between 225-250 bins, which in fact leads to the right threshold value selection ranges.
An Edge, the Savior
By segmentation, we passed the very first challenge of differentiating foreground from background. Now even though we have identified the presence of foreground objects; the system should also find the probable location and type of these objects in the picture. This is another task which the algorithm is responsible for. Analyzing more on the threshold technique, which is dependent on a specific threshold value, what could be another feature in the image through which we can find the presence of distinct objects? Let us consider each pixel and see its value variation compared to its neighbouring pixel value. If we try to plot this variation, primarily grouping the similar values and the direction of its intensity variation direction (named as slope or descent), we get to know of something called edges in the images. Now edges are nothing but object boundaries. and in one way counting the number of closed edges (contours), we can predict the possibilities of the presence of an object and its location. Figure 5 displays the output of edge detection on the sample image using canny edge detection method from the OpenCV library.
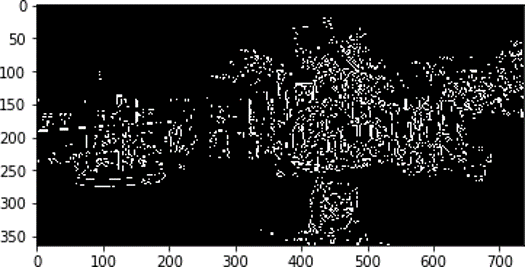
Fig 5: Canny Edge Detection in sample Image
This is in one way an enhanced version of our initial threshold technique, but we have another interesting challenge with respect to the number, size, shape of the edges detected and also whether the edges found are from the same object or from different objects. How do we make a decision on these edges and link to specific objects? …How do we locate and tag their locations as different objects in the picture? And finally, how do we identify each object, in our case ‘human’.? From this point onwards, we could find different approaches adopted by various researchers in identifying objects and location. Every approach is finally evaluated against its object prediction and localization score along with the processing time. For all real-time applications, the processing time will be a critical measurement matrix along with the accuracy of the prediction. The lower the prediction time, the near-live the operation will be. For a lower prediction time, we need less complex prediction algorithms and calculations, but not at the cost of accuracy. All approaches are based on striking a fine balance between accuracy and prediction time.
Contours & Bounding boxes Approach
Once the edges are detected, the next step could be to join similar edges falling in place in a line and form a closed curve called the contours. Not all edges can be closed and made as contours due to the difference in image pixel intensities and lighting conditions. A certain level of approximation could be done to make the maximum possible closed curves. Once that has been done, the next step will be to select the external contours which embed child contours and make it is as the first list of object proposals. We shall find the centroid of those contours and draw bounding boxes around these initial list of object proposals. We call it as proposals as we have not yet confirmed about its Objectness score. Once we have the object proposal and relative location information (bounding box), the next step will be to authorize the Objectness score and decide its type, which is performed by the mystery function.
Mystery function
Now we were able to detect the presence of an object (proposal) and its relative location. The next step is to classify this object as a particular type. Also, to limit our scope, we are not going to address each and every object in the image; instead, we are interested in a particular class of object say ‘human’. If we can find a pattern of features in the picture that matches with an already identified pattern for a particular class of object, then we can say that we have detected the presence of that type of class object in that picture. But, how do we find this pattern of features? Also, how can we generalize these patterns to make them immune to size, scale, lighting conditions etc. of the image and the object under analysis.

Fig 6: Mystery function
This takes us to an interesting topic of feature extraction and finding a function called the ‘mystery function’ which will explain the object from the features extracted. This mystery function helps you calculate the correct proportion in which each of the critical features should be present to detect the presence of the specific object in that image. We call it as machine learning or deep learning process using a significant amount of sample object class images to train and generate parameters of this mystery function. In this article, we will not discuss details about how we find that mystery function as there are several online references that discuss about feature extraction using convolution layers and then identifying the function with fully connected neural layers by feedforward, loss function and backpropagation process.
Grid and Anchor approach
We discussed about the contours and bounding box approach. This approach is more programmatical and systematic. Let’s see another approach which is closer to how humans make the object detection, classification and localization. Let’s call it as the Grid and Anchor approach. Again, let’s go step – by step. Let us divide the image into a certain number of grid cells and try to analyze each grid cell for the presence of the object. Good Idea! At least we could come one step closer to the location of an expected object proposal. But we do have challenges with this approach as well. This will be an excellent approach if our expected objects fall entirely within one cell. What will be the case if our object spans across multiple cells? Also, what should be an ideal grid size by which we can divide the image. It can start from 1×1 and go up to NxN.
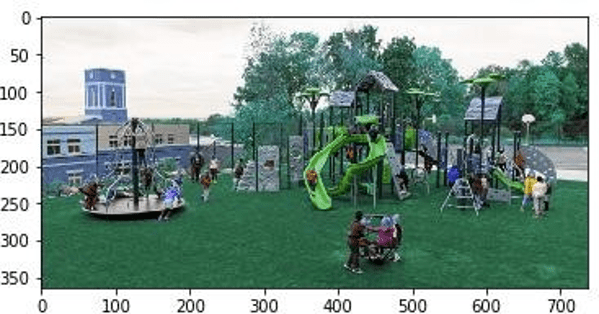
Fig 7: Grid Search
The performance of this approach with respect to Objectness score, localization and processing time depends on this hyperparameter selection similar to the threshold values and contours approximation as discussed earlier.
How Human vision scans objects
Before we go ahead with the next step of our grid approach, let us ask ourselves …How do we deal with this problem as humans? Here we do some approximations purely based on our previous experiences on a trial and error basis. Human computation power is so high that we don’t realize the number of scans we do before we detect an object. The grid size used is also dynamic, based on image object distribution. In our first glance, we might have already decided what we would like to see in that image based on the context. We would look for what we want to see and ignore what we are not interested to see (noise). We adjust our search window sizes dynamically based on object distribution and also matching to the scale of the object under search. In cases where we need to detect all objects or a certain type of objects, we usually scan the same image multiple times and it is not always successful that we find all the objects in a single scan. Based on each individual’s attentive power and focus, the results may vary. Now, probably our machine can also be tuned on a case by case basis of object detection. Our search for objects can be optimized for different object types so that it can work faster, rather than going with a generic search of all objects. Also, it is acceptable for machines to have a possibility for missed detection, compared to the performance of humans, provided the objects get detected in subsequent scans.
This is an important and efficient technique if we can translate it to an algorithm and run it on a competitive processing machine configuration. Humans perform the entire process at one blink of an eye. At this moment, a machine cannot beat that power and speed of a human, but we slowly start towards taking the machine in that direction.
Object search windows
In machine vision scan, the grid size, and the search window (anchor) sizes are fixed. For instance, we define “K” search windows with different scale and sizes fitting to the grid size for the image under vision.

Fig 8: Anchor windows
This anchor boxes extract information from its respective grid cells and feed inputs to a CNN network for feature extraction. Once the critical feature lists are extracted, we try to first focus on areas in the picture where more features are present. We place our search windows and lock their relative positions with respect to the image dimensions. Now we run our mystery function on the features present on each search window and detect the probability score of object presence. Then select the box having the maximum probability score value and adjust the window size to fit the exact dimension of the detected object to form the bounding box. The relative coordinates of the bounding box with respect to the original image will be the object location. That’s it … In this approach, the size and scale of anchor boxes and the grid cells play a key role in deciding the model’s detecting capacity as well as the processing duration for completing the detection successfully.
Conclusion
Hope we had a good discussion on the overview of image detection and localization. Here we discussed about two basic approaches – to detect the presence of objects and to designate their location within an image. The concept is briefly described in simple steps here, and there are different opensource libraries available for implementation, which demands deeper developer expertise. This brief note is motivated from my readings on existing networks including R-CNN, Fast R-CNN, Faster R-CNN, Yolo, SSD, ResNet and many other image processing notes available for online reading.
AI field is evolving much faster and its application is finding relevance in every business domain. The international standards bodies are working together in setting up standards in this field to make its adoption easier and reliable for different business use-cases. In the next article, we will pick another interesting and relevant topic like Image Context Learning and Information Inferring.
The field of AI has a lot left to explore and experiment. I wish all to take this ride, which is one of the best futuristic technologies, the world is looking forward to. All the best!!!